How to buy and sell commodities through trading?
Among the assets on which it is possible to invest today, we find, in addition to shares and other currencies, commodities such as precious metals, energy commodities or agricultural commodities. In this category of our site, you will thus learn about the essential information for this type of investment with a presentation of this market and its assets and the elements to be taken into account to analyse its price. Before buying or selling commodities on the stock market, it is important to understand that trading in these stocks is risky and a thorough analysis is necessary.
The exchange rates of the main commodities
Raw materials
Precious metals
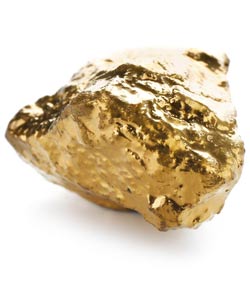
- Invest in gold through online trading
- Analysing the silver price before investing in trading
- Analyze the evolution of the gold price
- Analysis before trading on the copper price
- Can we predict the price of gold until 2030?
- BullionVault review for buying gold and silver
- Analyse the nickel price before investing
The commodities market is a vast and complex universe, where prices constantly fluctuate according to supply and demand, geopolitical and economic factors, and many other influences. Whether you're a seasoned investor or a novice, it's crucial to understand the forces that drive this market before making any buying or selling decisions.
Trading to buy and sell commodities
- Commodities are quoted on the market and have a stock market price
- Commodity prices vary according to supply and demand
- As an individual, you can invest in commodities online
- Commodity trading involves speculating on changes in the price of a commodity
- Commodities can be traded directly, by investing in shares or via CFDs
How do I invest in commodities?
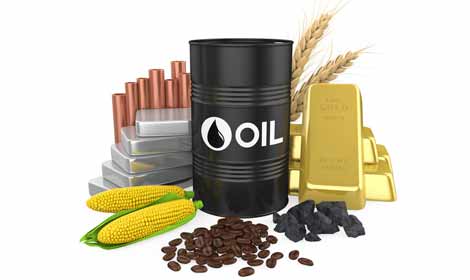
Commodities are tradable commodities such as oil, gold, wheat and copper. They are an important asset class and can be a way of diversifying your portfolio and protecting against inflation.
Here are some ways of investing in commodities:
1. Buying commodities directly:
- You can buy commodities directly, such as gold bars or barrels of oil.
- This requires a large initial investment and you need a place to store the commodities.
2. Invest in shares in commodities companies:
- You can buy shares in companies that explore, produce or sell commodities.
- This is an indirect way of investing in commodities and does not require a large initial investment.
3. Invest in commodity investment funds or ETFs:
- These funds invest in a basket of commodities, allowing you to diversify your investment.
- They are managed by professionals and are a simple way of investing in commodities.
4. Futures:
- Futures contracts are agreements to buy or sell a commodity at a specified price on a specified date.
- They are used to speculate on future commodity price movements.
- They are a derivative product and carry a high level of risk.
5. Contracts for Difference (CFDs):
- CFDs are derivatives that allow you to speculate on whether the price of a commodity will rise or fall.
- They allow you to take advantage of leverage, which can magnify your profits and losses.
- They are a complex product and carry a high level of risk.
What does commodities trading involve?
Commodity trading involves buying and selling commodities on a financial market. Commodities are basic products that can be traded, such as oil, gold, wheat and copper.
Here's how commodities trading works:
- Traders can buy and sell commodities on physical markets or on futures markets.
- Physical markets are where commodities are physically traded.
- Futures markets are where commodity futures contracts are traded.
- A futures contract is a contract that obliges the buyer to buy a commodity at a specified price on a specified date, and the seller to sell it.
- Commodity prices are determined by supply and demand.
Functioning of the commodities market :
There are two types of major players in the commodities market:
- The producers
- Financial institutions, investment companies and individuals
For the past few decades, most of the commodities traded on this market have been traded through derivatives such as forwards, futures, options, warrants or swaps. Transactions are carried out either on organised markets or on the OTC market, also known as the "over-the-counter market".
Organised markets are the stock and futures markets. Transactions are therefore standardised on various criteria such as quantity, quality or maturity for derivatives. A clearing house responsible for checking the solvency of buyers and sellers with margin calls prevents the risk of counterparty default on these markets.
The over-the-counter market, on the other hand, is a market in which transactions are concluded directly between buyers and sellers, without outside intervention. There is therefore no standardisation of transactions, but this market offers greater flexibility to the various players.
What commodities can I buy online?
Virtually all commodities traded on the financial markets can be the subject of investments or placements. But to find out more, here are the details of the assets most often found on this market:
- Energy commodities: With oil, natural gas, ethanol, uranium and coal.
- Metals and precious metals: With gold, silver, nickel, aluminium, palladium, platinum, copper, steel, iron, lead or zinc.
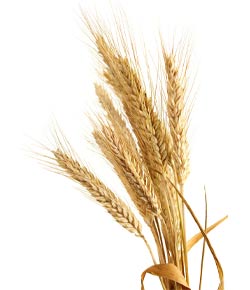
- Agricultural commodities: With coffee, sugar, wheat, maize, cocoa, rice, soya, oats or cotton.
Raw material quotation on the market :
Auction transactions are virtually non-existent on the commodities market, which is now almost entirely dematerialised and electronic.
The majority of trading is now carried out through the CME group, which includes the CBOT or Chicago Board Of Trade, the NYMEX or New York Mercantile Exchange and the COMEX or New York Commodity Exchange.
It is the largest futures exchange offering the widest choice of commodity contracts.
But there are also two other markets on which commodities are listed, albeit on a smaller scale. These are the LME or London Metal Exchange and the ICE or Intercontinental Exchange, formerly the NYSE.
Who is commodity trading for?
Commodity trading, once the preserve of institutional investors, is now of interest to many individual investors. But before buying or selling commodities, it is of course essential to have sufficient knowledge and experience of stock market investment in general.
Investors who choose to trade commodities may do so for different reasons depending on the strategy they choose. For example, some investors will prefer to take long-term positions on certain assets considered as safe havens, such as gold for example, and with the aim of possibly hedging other positions on other types of assets.
Still others, more seasoned, will use the high volatility of some of these assets to speculate with a shorter term strategy.
The opening hours of the commodity markets :
Let's first look at the opening hours of the financial markets on which the main commodities are listed. Indeed, it is during these hours that prices will be most volatile, as many investors will be connected and will take positions. Here are the market trading hours:
- The market for energy commodities such as gas and oil opens from 00:05 to 22:55.
- The market for precious metals, including gold, silver, copper and palladium, also opens from 00:05 to 22:55.
- The market for other metals such as zinc, aluminium and nickel opens from 2:05 am to 6:55 pm.
Note that these markets are open Monday to Friday during these hours, but are closed on Sundays.
At what times can we speculate on commodities?
The opening hours of the markets we have just mentioned are for information purposes only as you can trade continuously, i.e. 7 days a week and 24 hours a day on these commodities. Indeed, even if the markets are closed on Sundays or during the few hours concerned, the trading platforms allow you to take positions on these assets.
It should be noted, however, that trading during the closing hours of the commodity markets requires more knowledge and experience as it can also be more risky.
Anticipate the price of commodities with technical analysis :
As we have quickly explained above, commodities are highly volatile assets. Indeed, they are particularly reactive to various announcement effects, to the publication of certain indicators and events or to psychological impacts on the markets. It is therefore important to be able to detect them and to take them into account before buying or selling commodities on the stock market.
While fundamental analysis will make it possible to analyse the probable effects of a publication on the price of an asset, technical analysis will make it possible to study the strength of a trend, the volatility of a market and to deduce the most probable scenarios in view of what has happened in the past. It is therefore really important to master this type of analysis and to be able to study historical stock market graphs for commodities.
Innovative stock market charts that you can find online, on a trading platform or on a specialised site, allow you to customise displays and perform complex technical analysis. In particular, it makes sense to use and display several indicators simultaneously on these charts. These may include the most common trend and volatility indicators such as Bollinger Bands, MACD or moving averages as well as support and resistance levels and pivot points. These latter technical thresholds can be the starting point of an upward or downward trend, the signal for a trend reversal or an acceleration of a movement.
Of course, it is also important to choose the periodicity of the graphs used for the technical analysis of commodities. This periodicity must be chosen according to the trading horizon of each individual and the short, medium or long term strategy envisaged. There are indeed displays in minutes, hours, days, even months or years.
Although it is no longer necessary today to know how to carry out the calculations necessary to understand the major technical indicators ones oneself, since these are calculated automatically by software offered by brokers, it is strongly advised to understand from which elements and how they are calculated in order to better grasp their interpretation.
Finally, be aware that a good technical analysis will not be reliable if you do not take into account, at the same time, the fundamental analysis. You must carry out both types of analysis at the same time in order to take into account both graphical movements and news indicators.
Analysing the price of commodities with fundamental analysis :
As we have just indicated, fundamental analysis is the second type of analysis that is essential for understanding how the price of a raw material can evolve. This specific analysis uses various economic data and certain news items in order to anticipate future price movements of an asset.
Fundamental analysis of commodities will look at the relationship between the price of an asset and economic fundamentals such as unemployment, inflation, growth or interest rates. These economic fundamentals, which are constantly changing, are also influenced by geopolitical events or government decisions. They generally have a significant impact on most commodities. Knowing how to interpret these data in the context of fundamental analysis is therefore an essential prerequisite for analysing the price of a commodity.
Of course, the fundamental data to be used here, which can influence the price of commodities, are a little more diverse. The following publications, data and information are among the elements that you should absolutely analyse before buying or selling:
- Inflation: Historically, inflation and commodities have been positively correlated. Indeed, when inflation rises, the price of commodities tends to rise as well and vice versa, since some traders use the purchase of commodities to protect themselves from inflation.
- Economic growth: Like inflation, economic growth is correlated with the price of commodities. Indeed, when a country is in a phase of economic growth, it consumes more commodities, which increases demand and can raise prices, and conversely, when growth is low, the price of commodities tends to fall.
- The interest rate: An increase in the price of commodities tends to raise interest rates and lower the price of bonds.
- The consumption of certain sectors of activity: Depending on the raw material you trade, it will be important to monitor the economic activity of the sectors that use it the most and that will have a very great influence on the evolution of prices.
- The value of the U.S. dollar: It is well known that most commodities are quoted in U.S. dollars. Thus, there is a form of inverse correlation between this currency and these assets. Indeed, when the dollar is weak, it becomes more interesting for buyers with another currency to buy commodities and vice versa.
- Geopolitical relations: With regard to certain commodities such as oil, the conflicts that may oppose certain exporting or importing countries can have a strong influence on prices.
- Climatic conditions: If you trade in agricultural commodities, it will obviously be essential to also monitor the effect of certain climatic disasters on production and therefore on the price of these assets.
Of course, the fundamental data to be analysed varies from one raw material to another and we will tell you in each dedicated article which elements to focus on.
